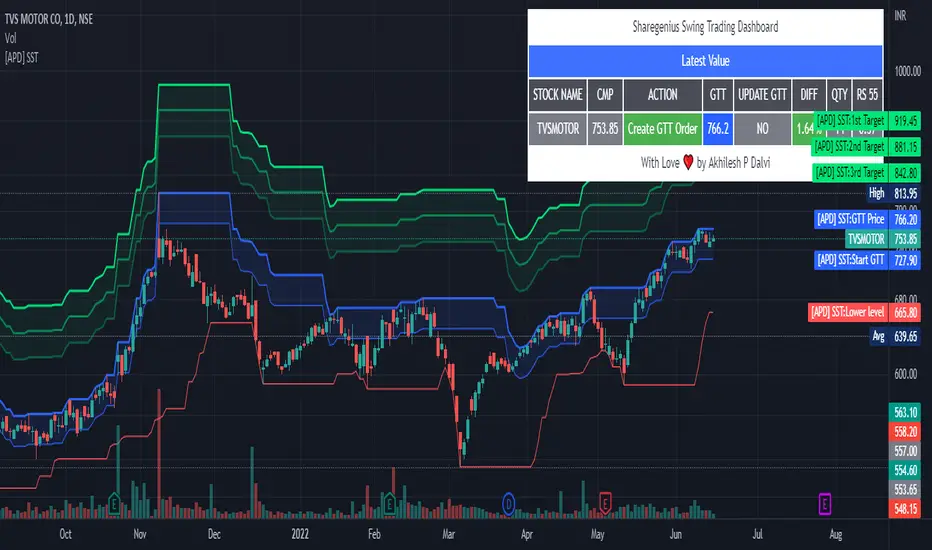
[APD] Sharegenius Swing Trading StrategyThis script plots GTT Price , Target Prices , Buy Zone , Target Zone and Information Dashboard according to Sharegenius Swing Trading Strategy. SST is for Swing Trading.
👉🏻 Strategy by Mahesh Kaushik -
1️⃣ Track the 20-Day Low of the instrument.
2️⃣ Create a GTT order which is 5% above 20 DL.
3️⃣ If the share makes a new 20 DL before getting purchased, then update your GTT order to be 5% above the new 20 DL.
4️⃣ Next GTT will be started when the average price falls by 10%. (GTT will be created as 5% above the last 20 DL or Buy on 10%, 20%, 30% fall in average price.)
5️⃣ Sell target is 5% of the average price. Sell all units or Set sell target on buy price.
6️⃣ No stop loss is needed as we buy when the stock falls.
👉🏻 Note:-
Trade in fundamentally good stocks & strong stocks those are outperforming index because we do not take stop loss in this strategy.
DISCLAIMER:- This Script is for educational purposes only. Nothing in this content should be interpreted as financial advice or a recommendation to buy or sell any sort of security or investment.
Cerca negli script per "swing trading"
RSI Swing Trading Setup (2-Period)A simple script that adjusts the RSI visibly in order to better accommodate swing trading and certain swing trading setups/strategies.
--------------------------------------------------------------------------------------------------------------------------------------------------------
Best used in conjunction with "Linear Regression Channel by LonesomeTheBlue" with 2.2σ (std.dev) and Show Fib Levels.
^Click image for a redirect to that script.
--------------------------------------------------------------------------------------------------------------------------------------------------------
In certain price action patterns:
A bearish reversal from a previously bullish move can indicate tops of a rally if the RSI moves from 0-40 to 60 (1)
A bullish reversal from a previously bearish move can indicate bottoms of a pullback if the RSI moves from 60-100 to 40 (2)
(USE THE LINEAR REGRESSION CHANNEL TO VALIDIFY THE RETRACEMENTS)
--------------------------------------------------------------------------------------------------------------------------------------------------------
(1)
--------------------------------------------------------------------------------------------------------------------------------------------------------
(2)
--------------------------------------------------------------------------------------------------------------------------------------------------------

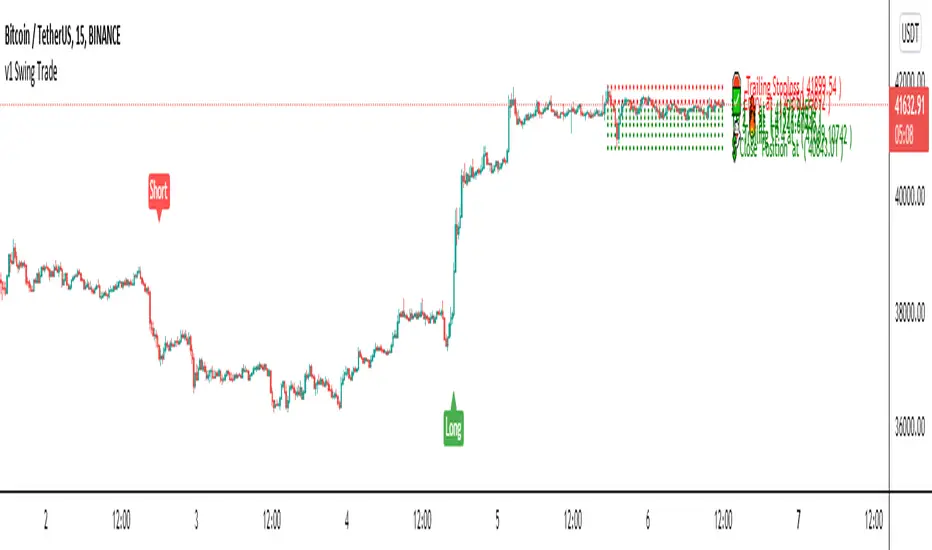
v1 Swing TradeHello friends
I have completed the "Swing Trading" Indicator that I have been working on for a long time.
I would like to briefly explain what it does and how it works.
Cryptocurrency Markets have high volatility. Of course, money is made by holding, but we are aware that there are more opportunities in the market as the ebb and flow. I must underline that it is "SMALL" by taking small risks to seize this opportunity. This indicator, which will help us to turn these opportunities to our advantage by taking small risks, briefly works as follows.
It is a blend of 1 indicator, which is based on fibonacci and pivot points, and supports atr indicator data in the background.
I determined the important values of Fibonnaci as entry and exit points. I then completed it with the atr indicator. atr fibonacci automatically pulls the walking graph invisibly.
This data is automatically mixed with the atr indicator.
When the price candles rise above the atr band, the long entry of the entry price comes. immediately after, the stop loss level is set “SMALL”.
Likewise, at the end of 1 Rising Trend, Stuck Prices Will Correct. When the price candles fall below the Atr Band, a short signal comes. and then a "SMALL" Stoploss level is determined together with the entry price.
After entering the position, the following stoploss and take profit work. ( Moves with the Trend, Stop Price Does Not Slip In The Opposite Direction After The First Entry. )
If the trade turns into profit after the stop loss level you entered, you should move your stop loss level together with the algorithm and exit the trade with minimum loss and maximum profit.
Trailing Stoploss
Now it's time to close the position. Price started to shrink. Swing trading Opportunity May Come.
What should the user pay attention to ?
Signal should be expected as in the first image.
When entering the trade, you should definitely put a stoploss.
If the Trade Opportunity is Late, the Transaction should not be entered.
And most importantly, you should carry your stoploss level with the algorithm.
Matters to be Considered in the Settings Tab;
Candles to lookback ( Do not reduce the number of past candles below 50.)
Reverse Target Point ( Definitely Must Stay Active. Don't turn it off.)
Formula a and formula b values increase the signal rate. But Too Many Signals Are Not Healthy.
I wish everyone a lot of earnings.
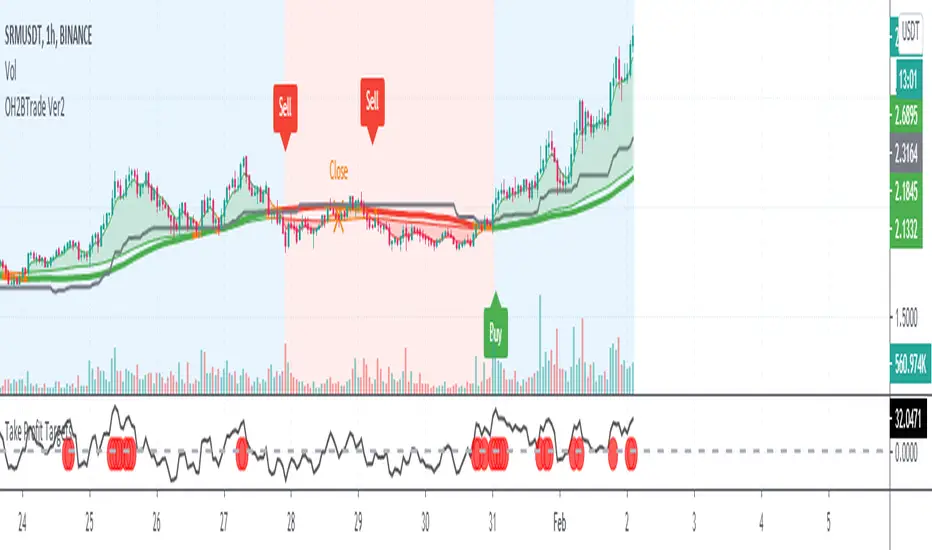
OH2B Trading Indicator for Swing TradingOH2B Trading Indicator
The OH2B Trading Indicator is an indicator built for advanced traders.
It gives you entry points for BUY and SELL based on Trend Channel and Ema-Crossover.
It offers you a higher frequency of signals for swing trading.
The Take-Profit Indicator gives you exit points for taking profits based on the Average Directional Index and Relative Strength Index.
Trading with Both Indicators
Orange Zone : Wait for the next signal from OH2B Trading Indicator.
The OH2B Trading Indicator gives you entry points for BUY or SELL .
When the ema1 crosses above ema2, the trend channel will be painted GREEN in color, and a BUY signal will appear. = BUY
When the ema1 crosses below ema2, the trend channel will be painted RED in color, and a SELL signal will appear. = SELL
When a BUY or SELL signal appears on the chart, don't rush into any trade.
Please allow a few hours for confirmation of signals .
To take profit, please follow the Take-Profit Indicator at the bottom.
RED dots are the Take-Profit targets for the BUY (long) signal
GREEN dots are the Take-Profit targets for the SELL (short) signal
*After taking profit, please set a Stoploss to at least break-even level to protect your profits.
When the price enters the Orange Zone again, you may close your trade and wait for the next signal.
If you like to keep your positions at Orange Zone, please remember to set a stop-loss alert when an opposite signal pops up on the chart.
Often the price goes to the Trendline after the signal, so keep some funds to increase the position or even open all position near the Trendline , or use it for re-enter with SL after you closed position on TPs.
Tips for the traders:
Recommended using the indicators at 1H Timeframe .
Recommended using the indicators for Spot Trading at both Crypto and Stock Market.
Do not use leverage above 5x.
No more than 5% of the deposit in one trade.
Try to enter/exit a position by limit orders.
Do not rush into any trade when a new signal pops up, please allow a few hours for confirmation of signals.
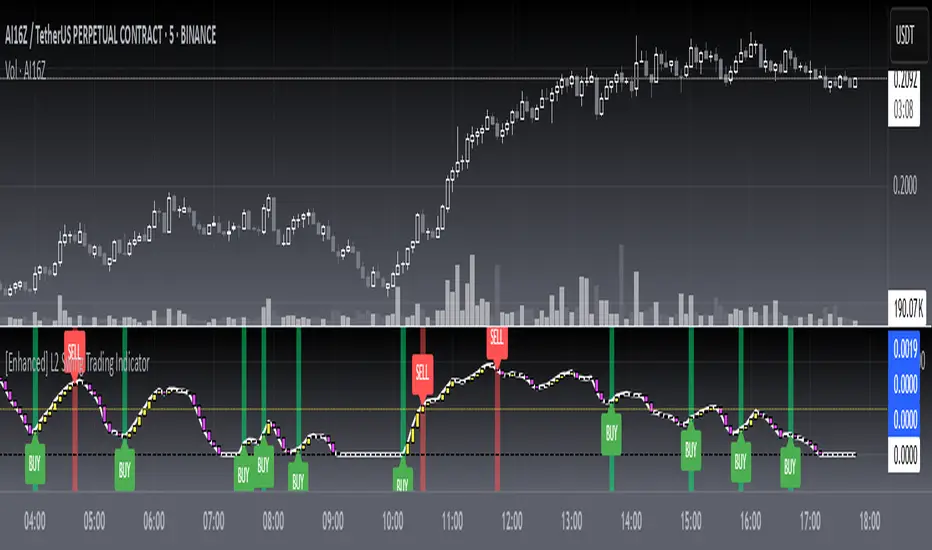
[blackcat] L2 Swing Trading IndicatorLevel: 2
Background
Swing trading is a type of trading aimed at making short to medium term profits from a trading pair over a period of a few days to several weeks. Swing traders mainly use technical analysis to look for trading opportunities. In addition to analyzing price trends and patterns, these traders can also use fundamental analysis.
Function
L2 Swing Trading Indicator
Key Signal
trend --> trend line with color candles standing for trend strength
pump --> whale pump indicator
top --> top zone for selling point
bbuy --> botton zone for buying point
varr1 ---> for selling points
bullbear --> use 50 as bull bear boundary
Pros and Cons
Pros:
1. Clear to see the trend reversals with strength changes
2. Whale pump indicator confirm the validity of trend reversals
Cons:
1. oversold zone is hidden due to using zero line as bottom
Remarks
NA
Readme
In real life, I am a prolific inventor. I have successfully applied for more than 60 international and regional patents in the past 12 years. But in the past two years or so, I have tried to transfer my creativity to the development of trading strategies. Tradingview is the ideal platform for me. I am selecting and contributing some of the hundreds of scripts to publish in Tradingview community. Welcome everyone to interact with me to discuss these interesting pine scripts.
The scripts posted are categorized into 5 levels according to my efforts or manhours put into these works.
Level 1 : interesting script snippets or distinctive improvement from classic indicators or strategy. Level 1 scripts can usually appear in more complex indicators as a function module or element.
Level 2 : composite indicator/strategy. By selecting or combining several independent or dependent functions or sub indicators in proper way, the composite script exhibits a resonance phenomenon which can filter out noise or fake trading signal to enhance trading confidence level.
Level 3 : comprehensive indicator/strategy. They are simple trading systems based on my strategies. They are commonly containing several or all of entry signal, close signal, stop loss, take profit, re-entry, risk management, and position sizing techniques. Even some interesting fundamental and mass psychological aspects are incorporated.
Level 4 : script snippets or functions that do not disclose source code. Interesting element that can reveal market laws and work as raw material for indicators and strategies. If you find Level 1~2 scripts are helpful, Level 4 is a private version that took me far more efforts to develop.
Level 5 : indicator/strategy that do not disclose source code. private version of Level 3 script with my accumulated script processing skills or a large number of custom functions. I had a private function library built in past two years. Level 5 scripts use many of them to achieve private trading strategy.
[astropark] Crypto Swing Trading [alarms]Dear Followers,
today a Swing Trading Strategy , runnable on a bot , which works great from 30m timeframe and above. Best suggested timeframes are 1h and 4h.
If you are a scalper, you will love suggested entries for fast profit. You can run it from 1 minute timeframe if you are used to scalp trading and close each trade whenever you fell happy (a proper trailing stop strategy is suggested anyway).
This indicator can trigger till 5 or 20 buy or sell signals in a row before reverting (it changes greatly depending on timeframe you use), so use a proper money management .
This script will let you set alarms whenever a Buy or a Sell signal is drawn on chart. This way you can set all notifications you may need in order to be alerted on each triggered signal.
The backtesting-strategy version of this script can be found here below or by searching for "Crypto Swing Trading" and then choosing the "strategy" version.
Strategy results are calculated on the timeframe from January 2018 to now, so on about 2 years, using 10000$ as initial capital and working at 3x leverage (very safe leverage!).
This is not the "Holy Grail", so use a proper risk management strategy.
This is a premium indicator , so send me a private message in order to get access to this script.


Philakone 5EMA Swing Trading Strategy [Buy&Sell Signals]Fork of the "Philakone 55 EMA Swing Trading Strategy" made by lvynnil
-Added 200EMA
-Changed shape of the arrows and added text of Buy & Sell
All credits go to lvynnil
For more informations about the original script go to:

Scalping Swing Trading Tool R1-4 by JustUncleLDescription:
This study project is a "Scalping Swing trading Tool" and is an alternative to the "Scalping Pullback Tool R1". It is designed for a two pane TradingView chart layout :
the first pane set to 15min Time Frame;
the second pane set to 1min Time Frame(TF).
The tools incorporates the majority of the indicators needed to analyse and scalp Trends for Swings, PullBacks and reversals on 15min charts and 1min charts.
Incorporated within this tool are the following indicators:
1. The following EMAs are drawn automatically:
Green = EMA89 (15min TF) = EMA75 (1min TF)
Blue = EMA200 (15min TF) = EMA180 (1min TF)
Black = EMA633 (15min TF) = EMA540 (1min TF)
2. The 10EMA (default) High/Low+Close Price Action Channel (PAC), the PAC channel
display is disabled by default.
3. Optionally display Fractals and optional Fractal levels
4. Optional HH, LH, LL, HL finder.
5. Coloured coded Bar high lighting based on the PAC:
blue = bar closed above PAC
red = bar closed below PAC
gray = bar closed inside PAC
lime Line = EMA10 of bar close
6. Pivot points (disables Fractals automatically when selected) with optional labels.
7. EMA5-12 Channel is displayed by default.
8. EMA12-36 Ribbon is displayed by default
9. Optionally display EMA36 and PAC instead of EMA12-36 Ribbon.
Set up and hints:
I am unable to provide a full description here, as Pullback Trading incorporates a full trading Methodology, there are a number of articles and books written on the subject.
Set to two pane TradingView chart, set first pane to 15Min and second to 1min.
Set the chart to Heikin Ashi Candles (optional).
I also add a "Sweetspot Gold2" indicator to the chart as well to help with support and resistance finding and shows where the important "00" lines are.
Use the EMA200 on the 15min pane as the anchor. So when prices above EMA200 we only trade long (buy) and when prices below the EMA200 we only trade short (sell).
On the 15min chart draw any obvious Vertical Trend Lines (VTL), use Pivots point as a guide.
On the 15min chart what we’re looking for price to Pullback into the EMA5-12 Channel or EMA12-36 ribbon, we draw Trendlines uitilising the Pivot points or Fractals to guide your TL drawing.
On the 15min chart look for the trend to resume and break through the drawn TL. The bar color needs to change back to the trend direction colour to confirm as a break.
Now this break can be traded as a 15min trade or now look to the 1min chart.
On the 1min chart draw any Pullback into any of the EMAs.
On the 1min chart look for the trend to resume and break through the drawn TL. The bar color needs to change back to the trend direction colour to confirm as a break.
Now this break can be traded as a 1min trade.
There is also an option to select Pristine (ie Ideal) filtered Fractals, which look like tents or V shape 5-candle patterns. These are actually used to calculate the Pivot points as well.
Other than the "SweetSpot Gold2" indicator, you should not need any other indicator to successfully trade trends for Pullbacks and reversals. If you really want another indicator use the AO (Awesome Oscillator) as it is momentum based.

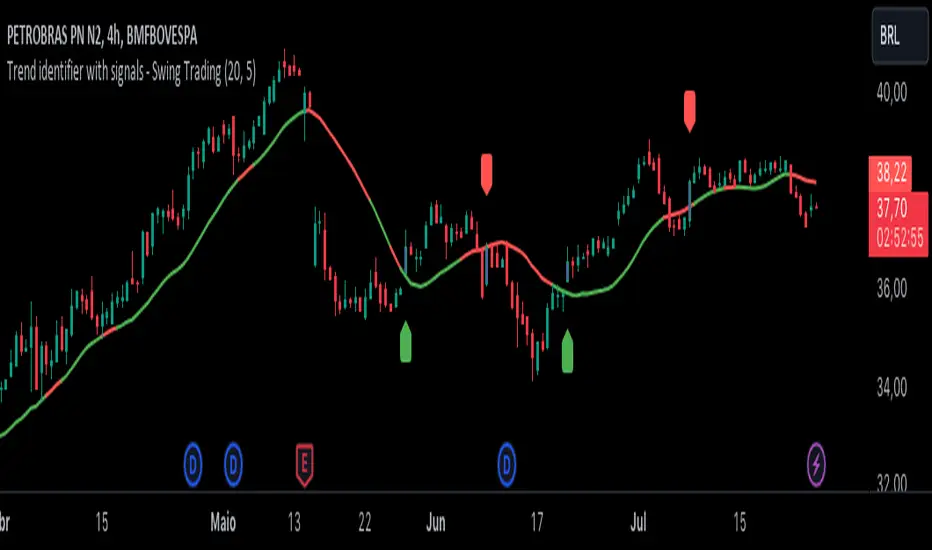
Trend identifier with signals - Swing TradingIndicator Objective
The "Trend identifier with signals - Swing Trading" indicator is designed to help traders identify market trends and provide clear visual signals for potential buy and sell points based on the interaction of price with the 20-period moving average.
How the Indicator Works
20-Period Moving Average:
The indicator calculates the 20-period simple moving average (SMA), which is a common tool for smoothing out price fluctuations and identifying the overall market direction.
The moving average is plotted on the chart, changing color according to the identified trend:
Green: Indicates an uptrend.
Red: Indicates a downtrend.
Gray: Indicates a neutral or undefined market condition.
Trend Identification on the Daily Chart:
The indicator checks the trend based on an adjustable period (default is 5 periods):
Uptrend: When the short-term moving average (5 periods) is above the long-term moving average (10 periods).
Downtrend: When the short-term moving average (5 periods) is below the long-term moving average (10 periods).
Signal for Touching the Moving Average:
When the price crosses the 20-period moving average, the candles are colored purple to indicate that there was a touch on the moving average.
This helps identify critical points where the price may reverse or continue its trend.
Trend Signal:
Green Flag: Appears below the candle when there is a touch on the moving average and the trend is up, suggesting a potential buy point.
Red Flag: Appears above the candle when there is a touch on the moving average and the trend is down, suggesting a potential sell point.
Lateral Zone Identification:
The indicator also checks if the price touched the moving average for 5 consecutive candles, indicating a possible consolidation or lateral zone.
If this occurs, a message "Possible Lateral Zone" is shown on the chart, helping the trader avoid trades in a market without a clear direction.
How the Indicator Helps Traders
Clear Trend Identification:
By changing the color of the moving average according to the trend (green for up, red for down), the indicator provides a clear visualization of market direction.
This allows traders to align their trades with the prevailing trend, increasing the probability of success.
Visual Buy and Sell Signals:
The green and red flags provide direct visual signals for potential entry and exit points, based on the interaction of price with the moving average.
This is particularly useful for novice traders who may struggle to identify these points on their own.
Risk Management and Trade Planning:
Identifying lateral zones helps traders avoid trading in trendless markets, where price movements are more unpredictable.
This improves risk management and allows traders to focus on more favorable opportunities.
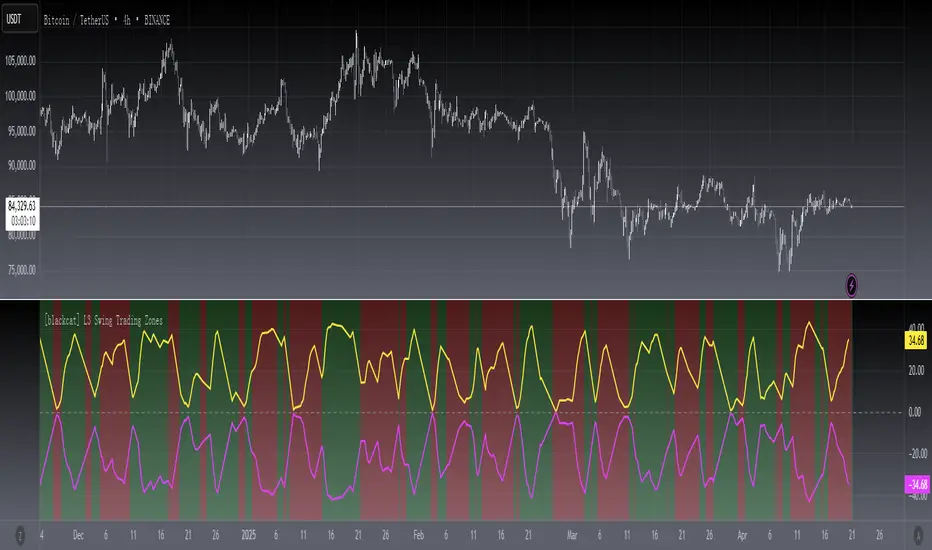
[blackcat] L3 Swing Trading ZonesLevel 3
Background
For swing trading, I consider a combination of multiple technical indicators to indicate periods of long and short positions.
Function
First, judge the daily-level long and short recommendations by the J value of the KDJ indicator in the weekly cycle. in addition. Second, draw bull-bear lines by integrating existing technical indicators such as rsi, adx, cci, dmi, etc. The bull line is above 0, the bear line is below 0, and the other is offsetting each other. When both are relatively close to the zero axis, it means that the strength is equal, and there will be signs of sideways.
Remarks
"D" timeframe ONLY.
Feedbacks are appreciated.
Beakdoo swing trading boxHi forks,
I'm trader Baekdoosan who trading Equity from South Korea. This Baekdoo swing trading box indicate good buying position when it crossover the box.
Here's the ideas
1. It needs to crossover 1 month highest value and higher than 5 ema and 20 ema line
2. It also needs to crossover 1 month volume as well
3. Once 1,2 soaring candle emerge, it needs to correction time
4. 5 ema or 20 ema or center candle's 2/3 point x 0.95 (5% lower) would be the resistant line
5. center candle's 2/3 point line would be the buying point (you may can trade when it cross over
you can check above example chart and take a look what you have interested in.
hope this will help your trading on equity as well as crypto. I didn't try it on futures . Best of luck all of you. Gazua~!
SIB AIO Swing TradingINTRODUCTION:
All-In-One Swing Trading signals are based on the change actions in the Price, Volume & Indicators (RSI, Stochastic, EMA, SMA).
-The Bottom signal is the result of the oscillator oversold zone computation.
-Conversely, the Top signal is the result of the oscillator overbought zone computation.
-The Bull/Bear Divider feature to determine the bullish and bearish market is plotted with the mid-term Exponential Moving Average.
-The chart background-color ease the user to identify immediate market trends on the change-action of the Simple Moving Average.
-The entries & exit signals are based on the Price and Volume action (Gained candle).
HOW TO ENTER:
-Look for Green-background area (Uptrend) &
-Candle price closed "ABOVE" Redline( Bull/Bear Divider) &
-*ENTRY signals appeared (Refer below signals explanation) &
-Enter when price breaks above the signaled candle (Gained candle).
HOW TO EXIT:
-*EXIT signals appeared (Refer to the below signals explanation) &
-Watch out on Red-dot or Blue-dot (Overbought) &
-Exit when price breaks below the signaled candle or
-Candle price closed "BELOW" the Redline (Bull/Bear Divider)
ENTRY Signals:
*Redline (Bull/Bear Divider) price closed "ABOVE" = Bullish.
*Green upward triangle = Potential bottom signal.
*Yellow diamond + BT = Potential bottom reversal signal.
*White candle = Turning point signal.
*White diamond = Strong buying momentum signal.
*White upward triangle = U-turn after correction signal.
*White dot = Potential entry point signal.
*Blue dot (below candle) = Potential entry point signal.
*Green dot 2 (below candle) = Potential entry point signal.
*Yellow candle + alert bell = Rally take-off signal.
*Green color background = indication of an UPTREND market.
EXIT Signals:
*Redline (Bull/Bear Divider) price closed "BELOW" = Bearish .
*Red dot (above candle) = Potential Top signal.
*Blue dot (above candle) = Potential Top signal.
*Blue candle = Weak market, rapid dropping, or panic selling.
*Red color background = indication of a DOWNTREND market.
Note:
Works best with the Heat Volume indicator: SIB Fuel moves Car, Volume moves Price.
Please contact or PM us to gain access.

Auto S/R With Swing TradingIn this indicator, you can simply get the automatic support and resistance line.
With this indication of High and Low by H and L with blue line support and resistance.
The second part is the swing trading setup.
Green line means the upside continue with BUY signal.
Yellow Line means a Trend reversal No Trading Zone & wait for the signal.
Red line indicates that the downside continues with the SELL signal.

EMA Cross - Swing Trading on the Daily (by Leb Crypto)This indicator is best used on the Daily Chart.
It's simple yet powerful.
All it does is indicate where the 8 EMA crosses over or under the 21 EMA, indicating a potential LONG or SHORT position opportunity.
You can back test this on many charts, and find that it has a pretty decent success rate.
Obviously, it is NOT to be used on its own. It's best combined with other technical analysis skills.
Nevertheless, it is helpful in Swing Trading on the Daily chart.
Long/Buy when the green circle appears.
Short/Sell when the red circle appears.
Enjoy it.
Cheers,
Leb Crypto

Auto Swing Trading IndicatorAuto Swing Trading Indicator is based on 5 different technical indicators. This indicator uses these different indicators to determine the best time to BUY and SELL. This Indicator will not Repaint and signal at candle close is final.
This Indicator is best used on 4 hrs timeframe. But can be used on any timeframe.
Targets (T1) are displayed when there is a BUY signal. Targets are based on the combination of previous High and Low.
The strategy is to sell 50% at T1 and ride until the SELL signal posted.
Buy and Sell Alerts are added for this indicator. In the Alerts window, please choose the option "Once the candle closes" for best results.
More features are going to be added to this indicator.
This is an invite-only script. Please message me for access

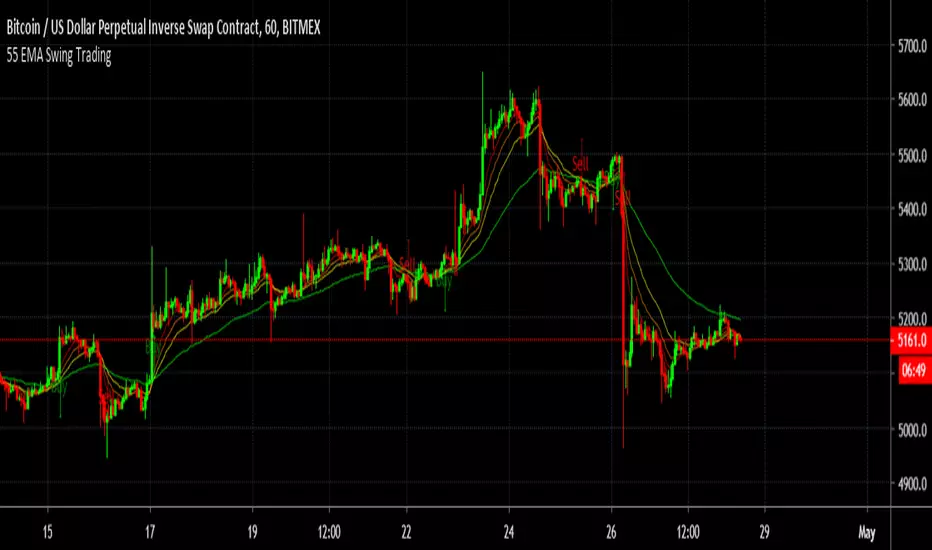
55 EMA Swing TradingA simple Buy and sell strategy using 55 EMA - " 55 EMA Swing Trading"
The source code is publicly available to for further modification.
Philakone 55 EMA and MA Swing Trading by ZekisPhilakone 55 EMA and MA Swing Trading by Zekis
A swing strategy based on 4 EMAs (8, 13, 21 and 55) developed by Philakone with a nice succes rate on +2h charts
I tried to make it more friendly for the eye and easier to use
What i added:
***the ability to change from EMA to MA
***arrows for a better view for entries/longs and exits/shorts
***colors to determine the trend/entries and exits/longs and shorts
***targets (%) for take profit and Stop Loss (all marked with dots)
***alerts for all of above
Enter long when color between fastest line and slowest line turns green or when green arrow shows up
Enter short when color between fastest line and slowest line turns red or when red arrow shows up
Enjoy!
@ Zekis